.jpg&w=1920&q=75)

Interim Report
Q1 2026
Overview
The Oslofjord Holding group reported revenue of 130.8 NOK million in the first quarter of 2026, compared with 134.1 NOK million in the same period the previous year. EBITDA was 38.5 NOK million, while EBIT was 8.4 NOK million. Profit before tax was -2.9 NOK million, compared with 4.9 NOK million in Q1 2025. The development must be viewed in light of lower activity levels in the quarter, as well as increased costs related to operations and depreciation.
Gross profit was 89.5 NOK million, compared with 96.9 NOK million the previous year. Oslofjord Property continued to deliver the strongest earnings contribution in the group, with EBITDA of 49.7 NOK million and profit before tax of 13.7 NOK million. Oslofjord Hotel recorded revenue growth in the quarter, while Oslofjord Convention Center and Oslofjord Catering had lower activity levels than in the same period in 2025. The development is within budgeted levels, and the first quarter traditionally has lower volumes than the peak seasons later in the year.
The group’s balance sheet continues to be characterised by significant property values, with total assets of 4,078.9 NOK million. Interest-bearing debt and liquidity are within the requirements of the bond agreement, with a good margin on all key ratios.
The main priority going forward is to increase activity levels in idle periods, strengthen capacity utilisation and continue the work on cost control.
Oslofjord Holding AS
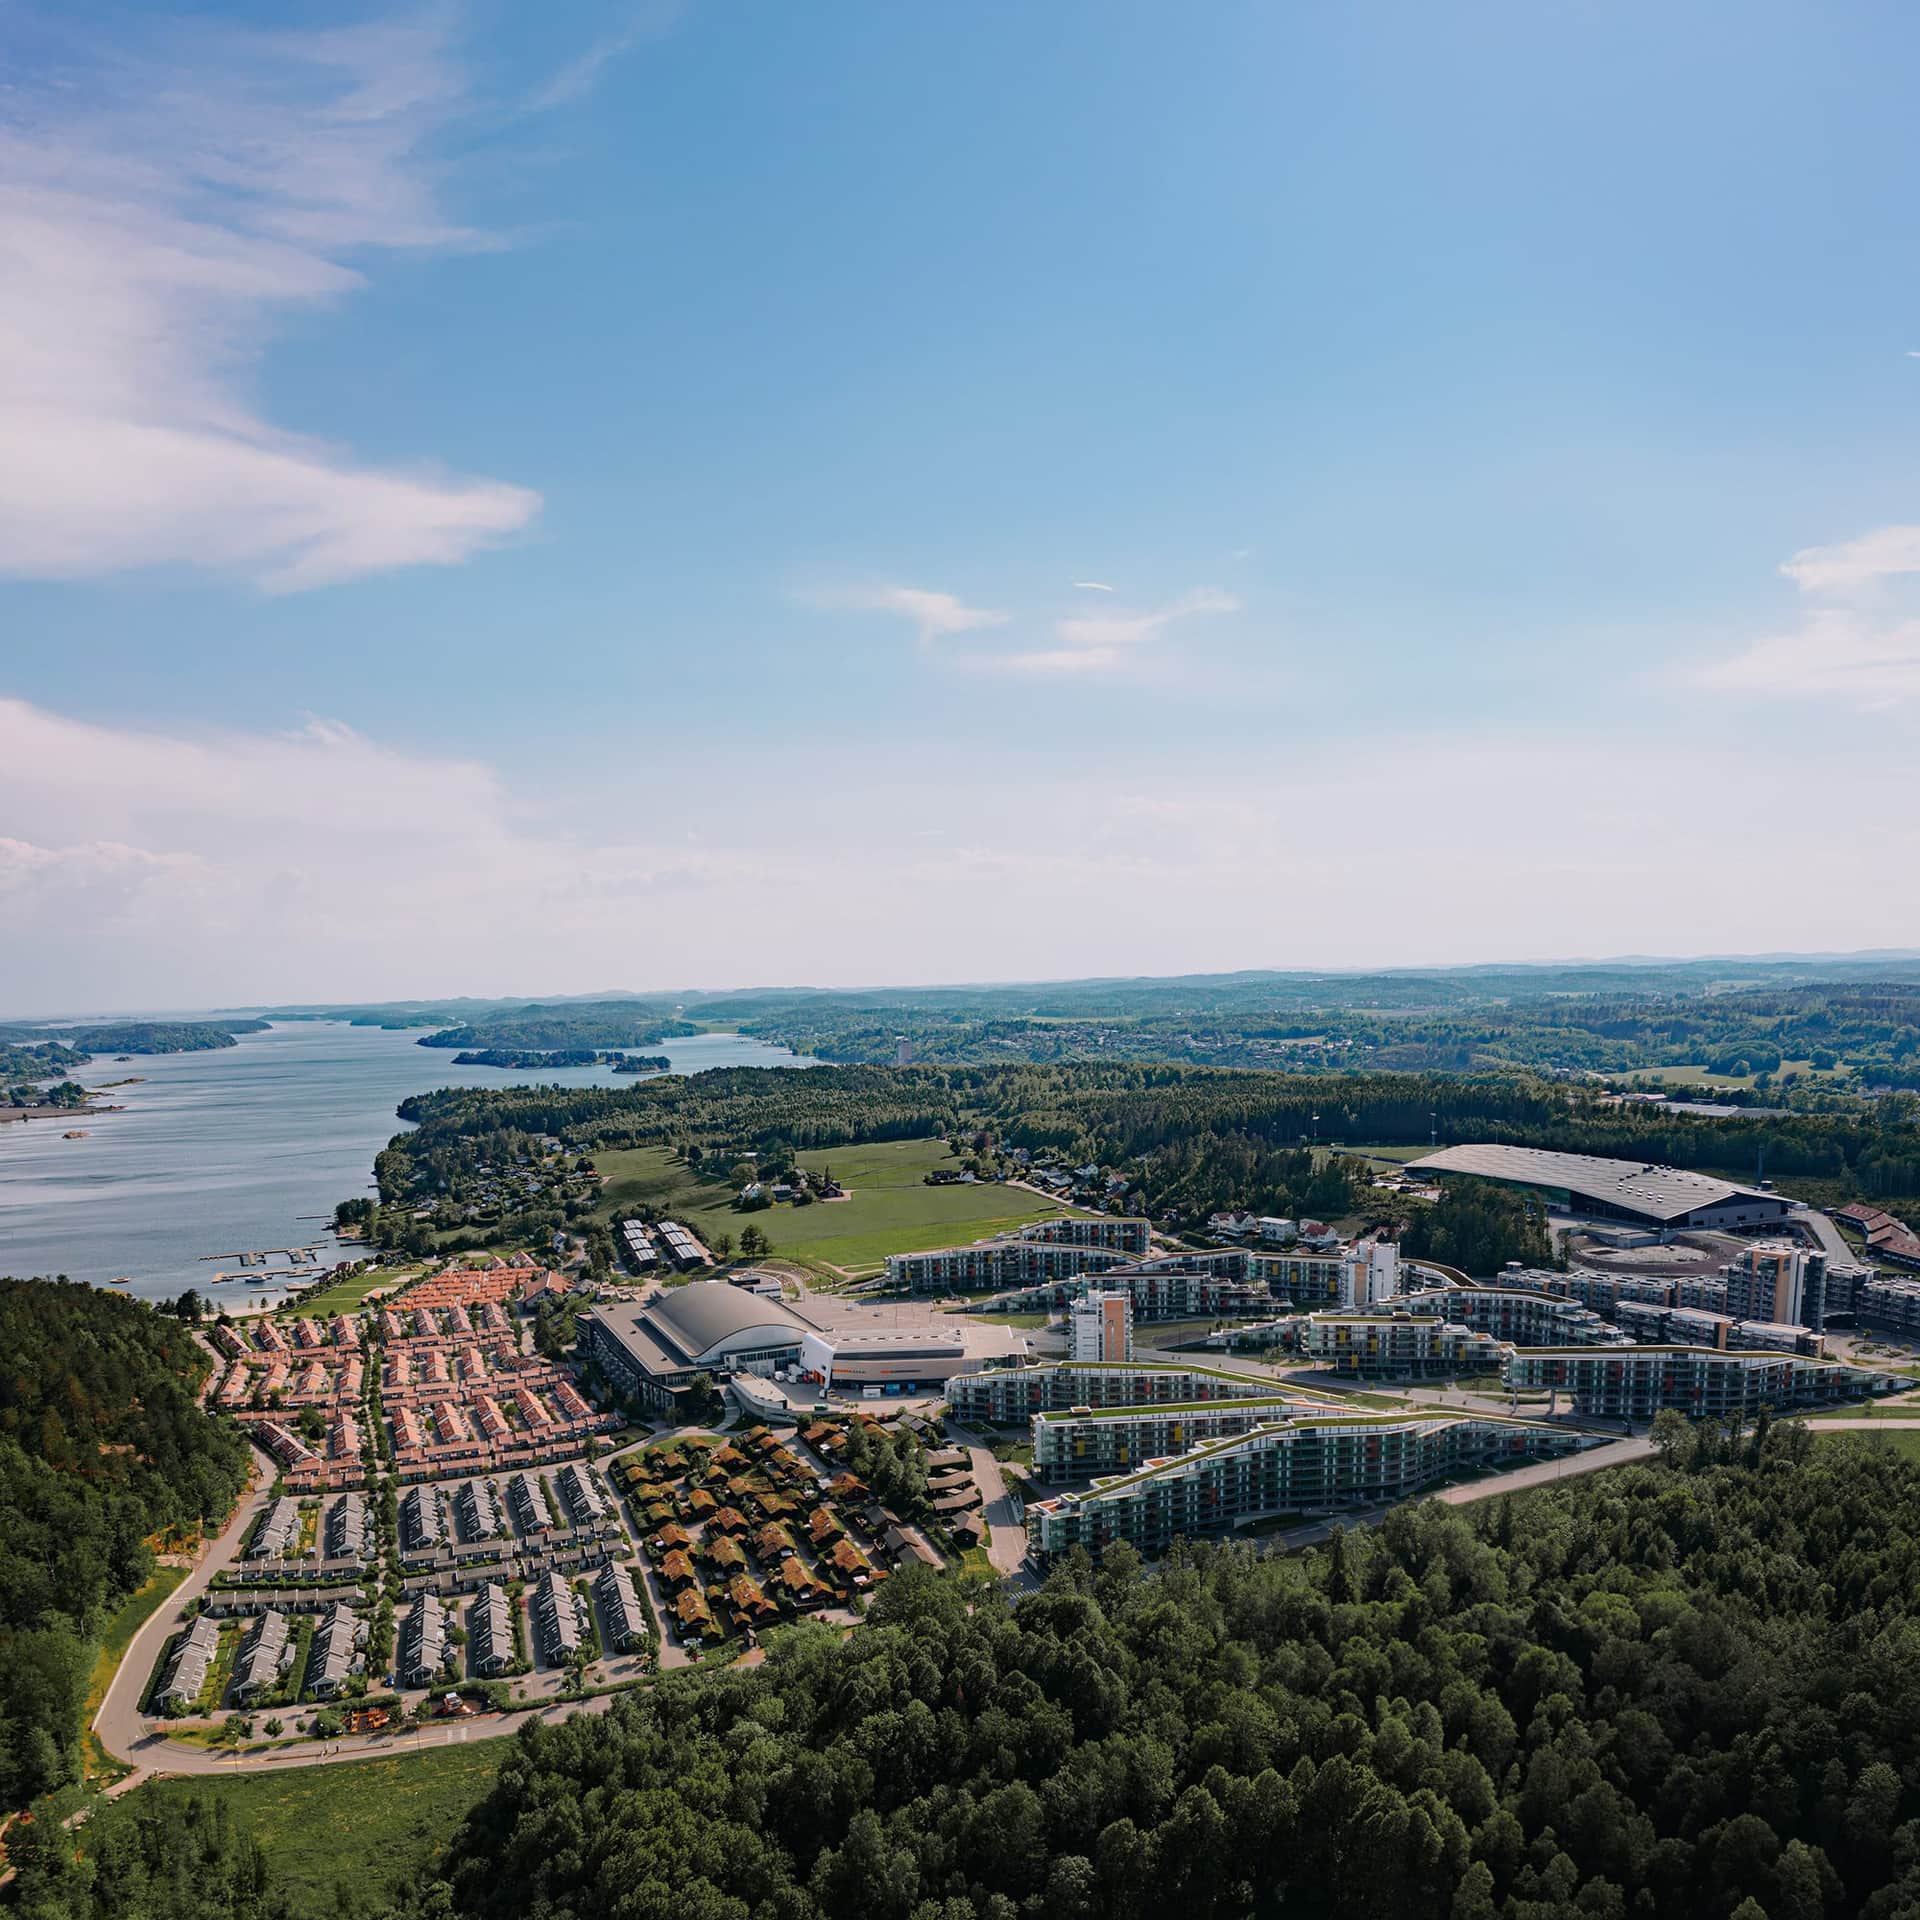
Oslofjord Holding AS owns and manages the businesses in the Oslofjord Group, including Oslofjord Convention Center in Vestfold.
In the period 2014–2022, approximately NOK 3.6 billion was invested in the development of Oslofjord Convention Center. From 2023, the facility appears complete and fully operational for hosting large events.
The Board of Directors of Oslofjord Holding AS has in the coming years prioritized further development of activity and capacity utilization at Oslofjord Convention Center. The initiative is aimed at increased commercial activity and further development of the conference and events business, based on the current conference village and the needs of the market.
The Group believes Oslofjord Convention Center has a solid foundation to contribute to event tourism, value creation and jobs in the region in the years ahead.
Oslofjord Holding AS is 100 % owned by Oslofjordstiftelsen (www.oslofjordstiftelsen.no).
Oslofjord Convention Center
The Hotel Village
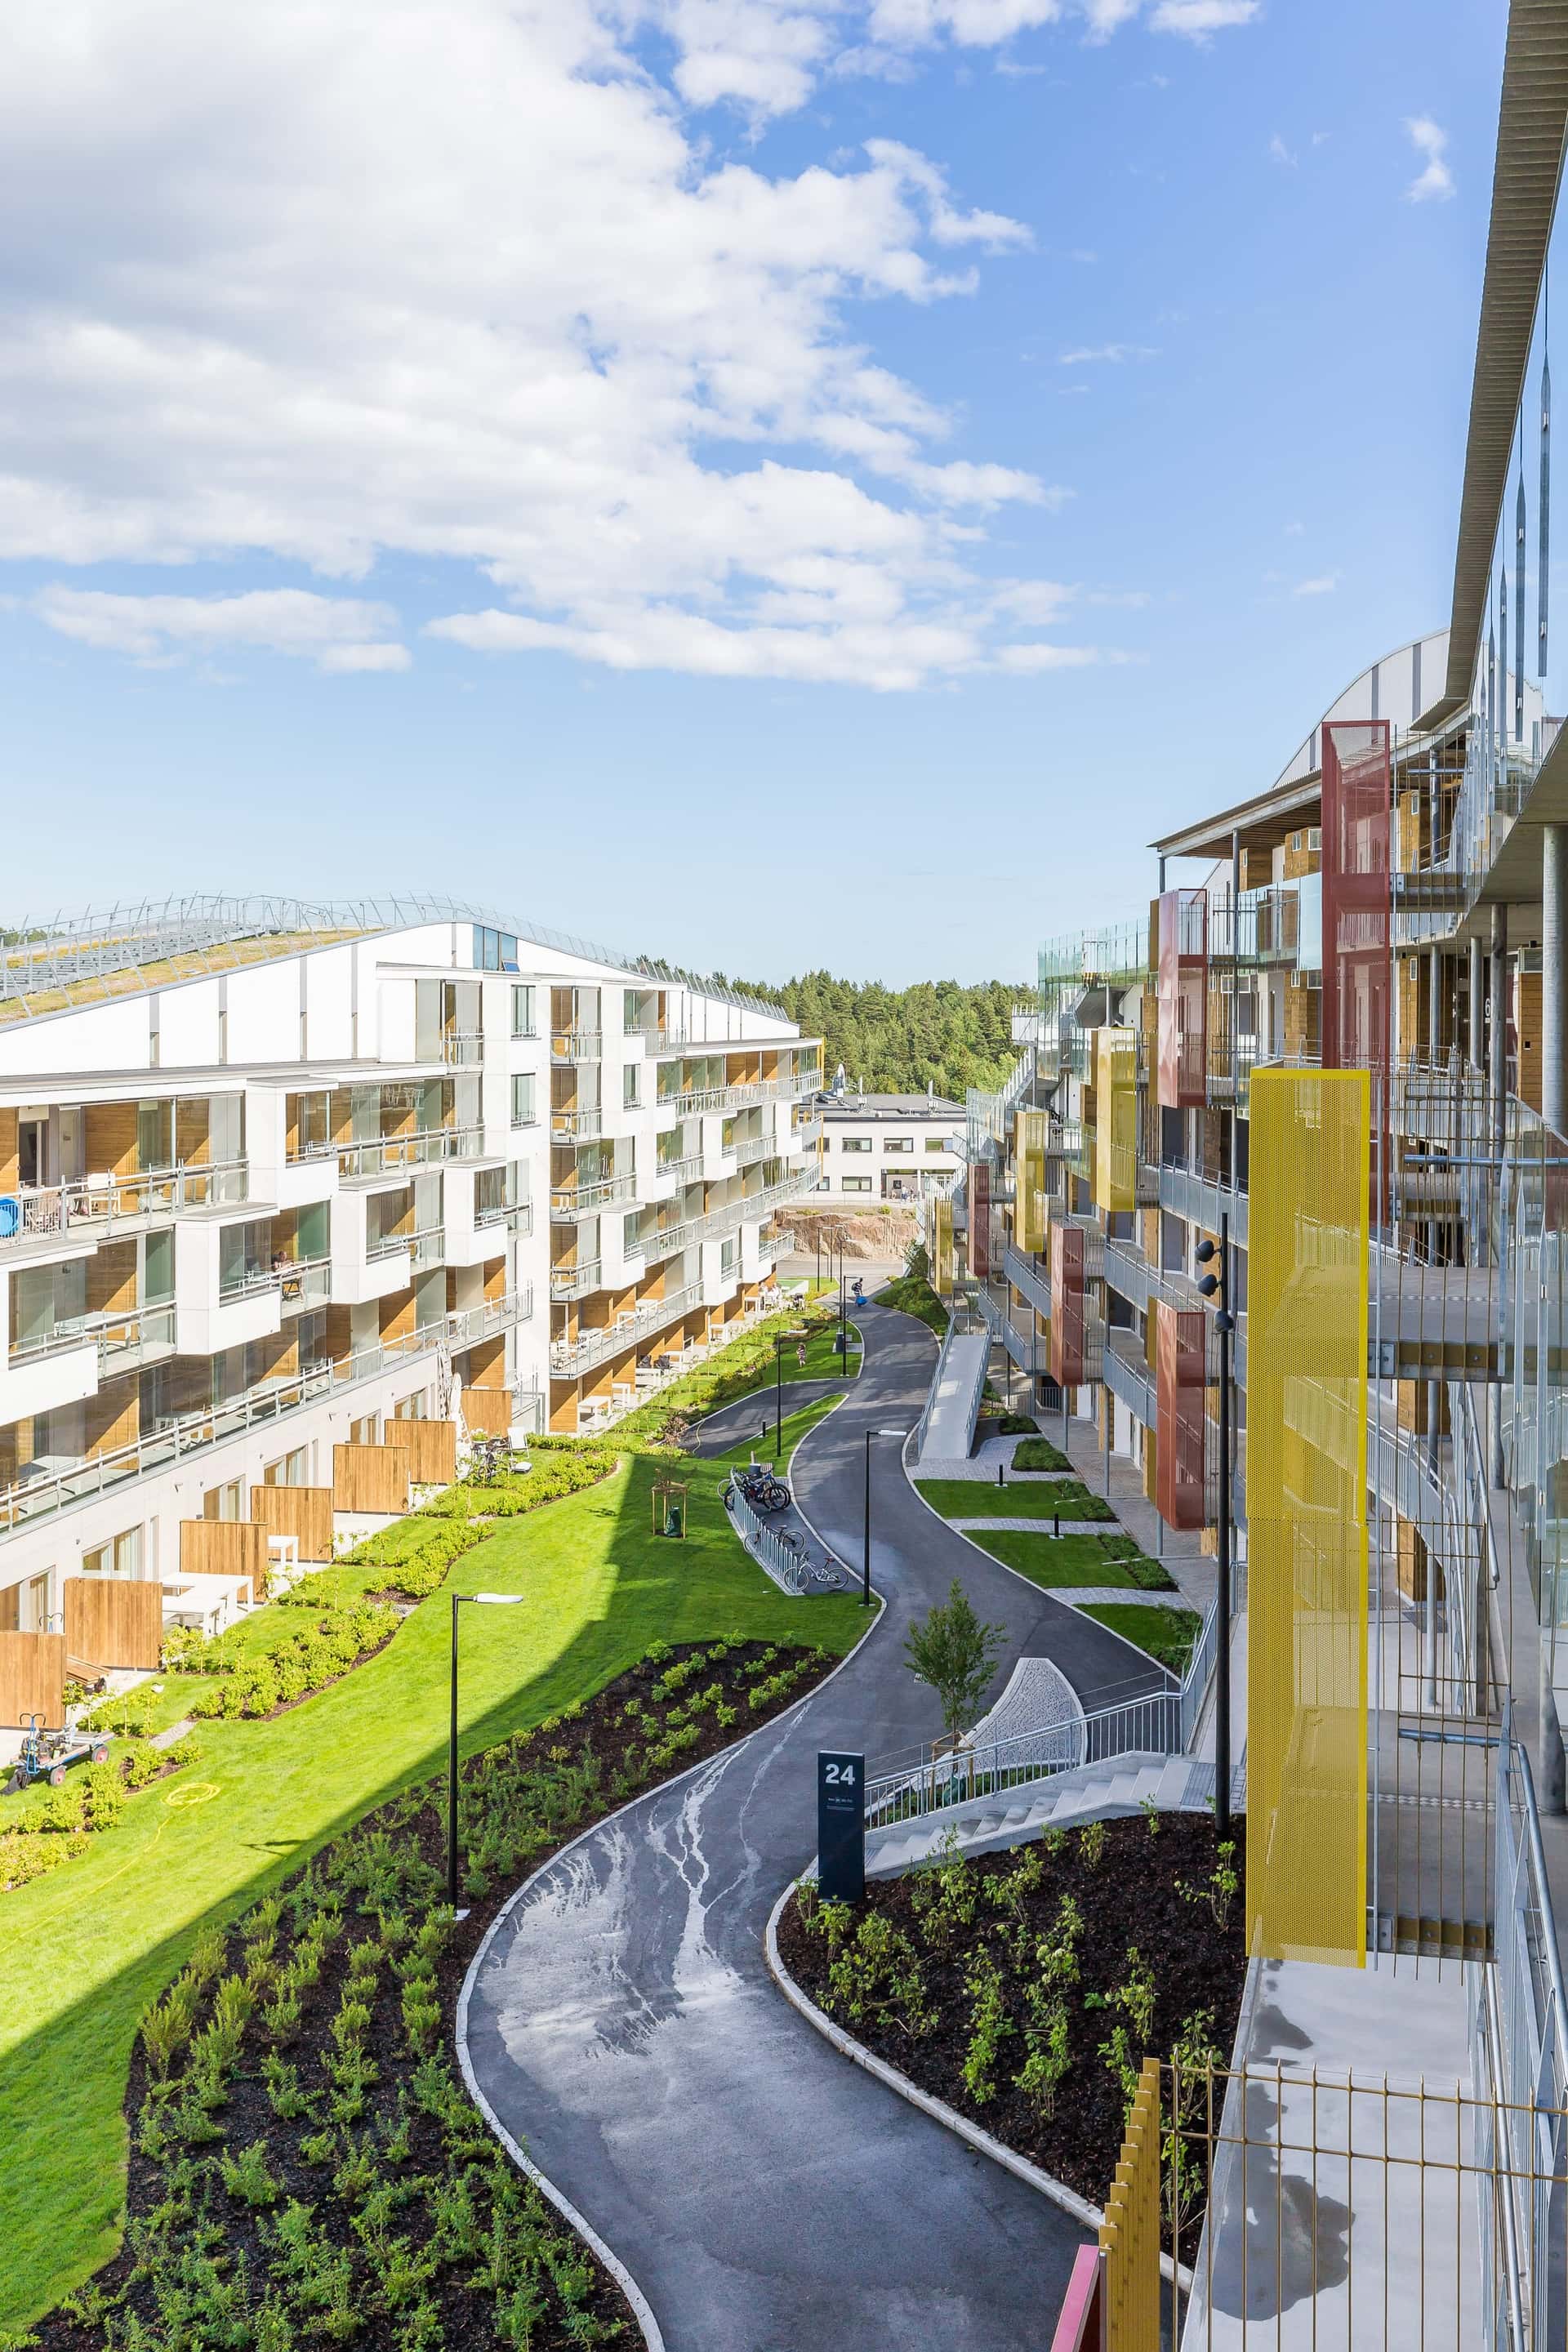
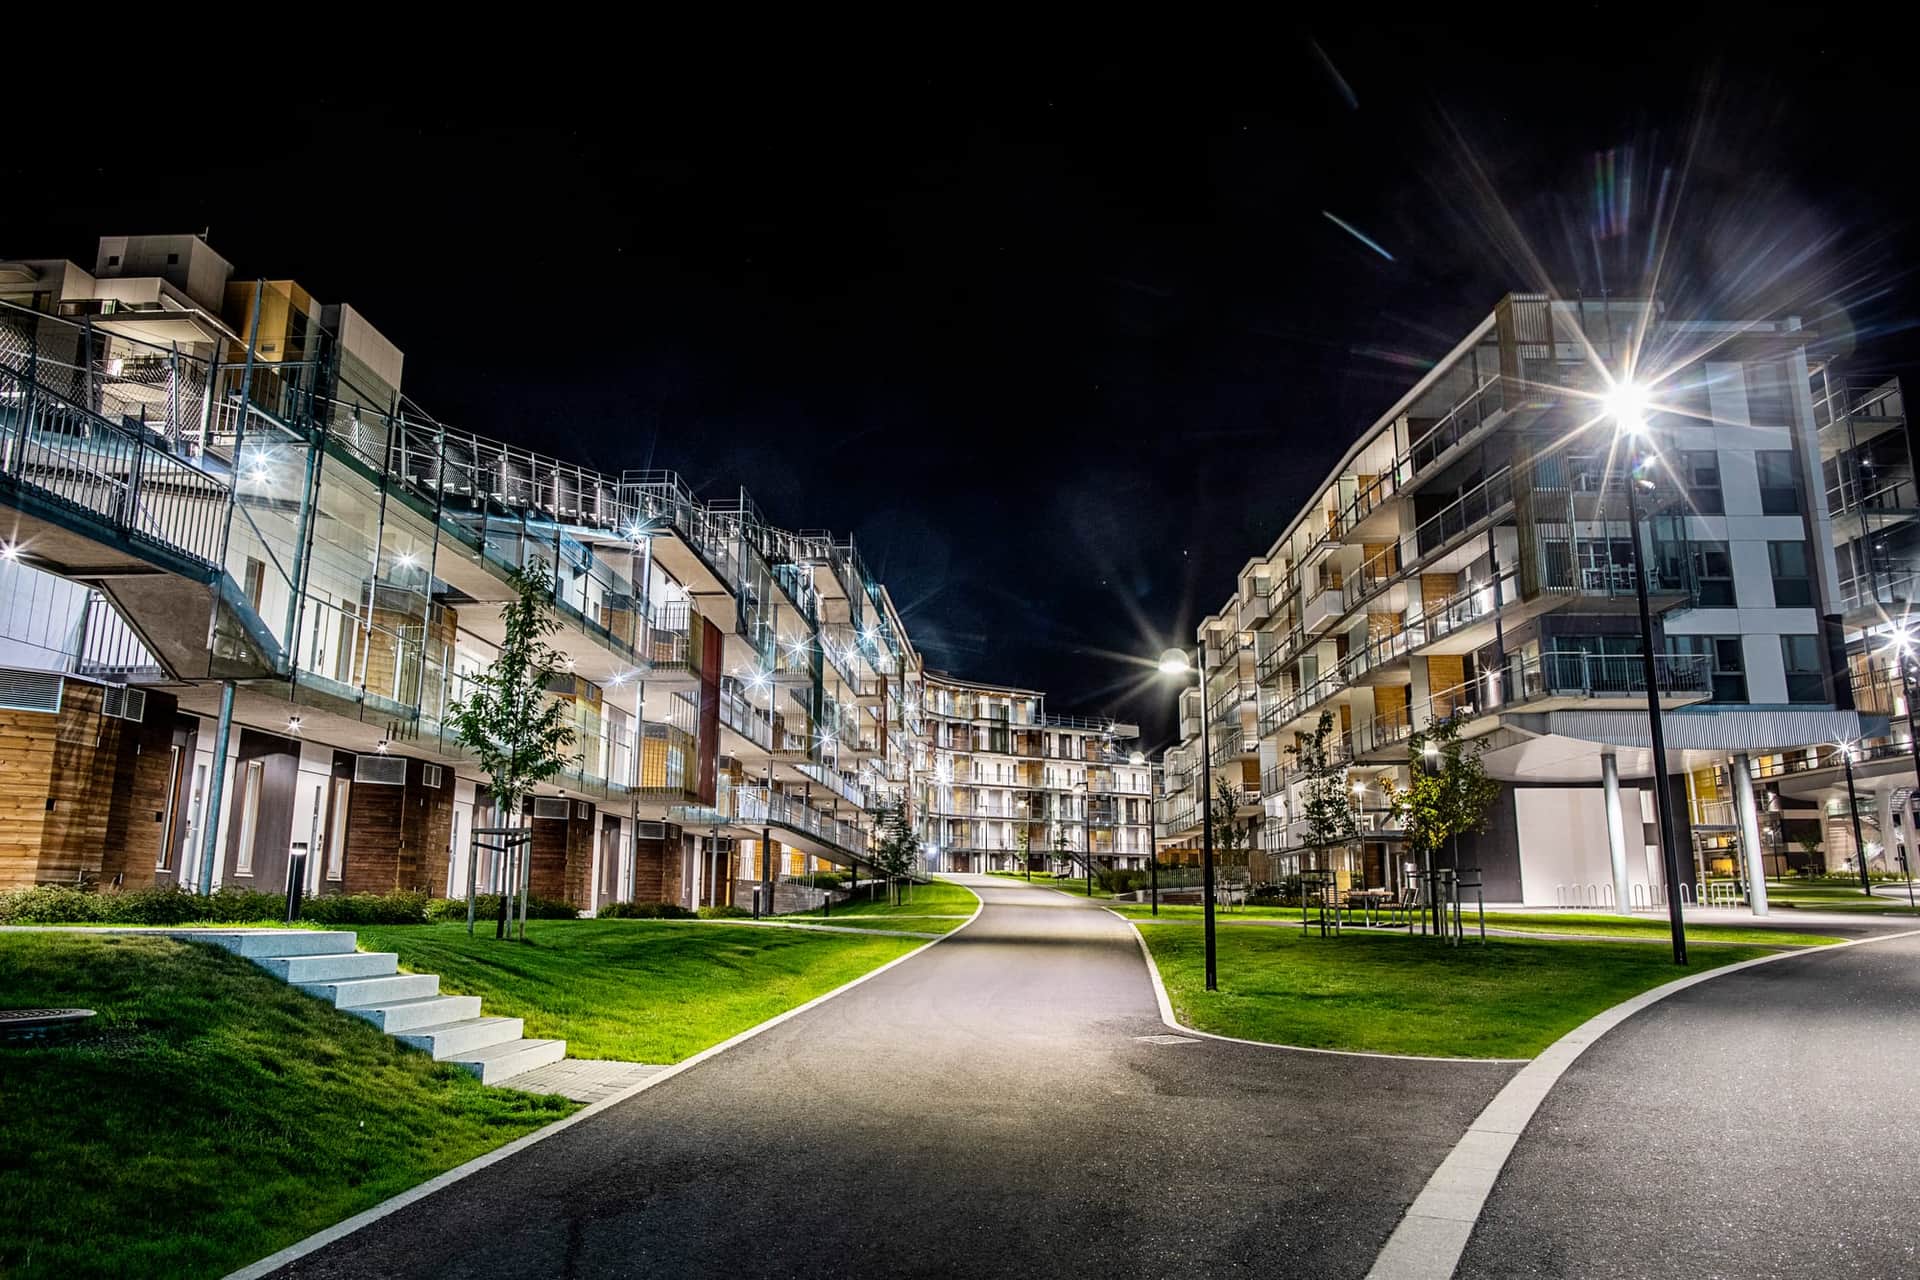
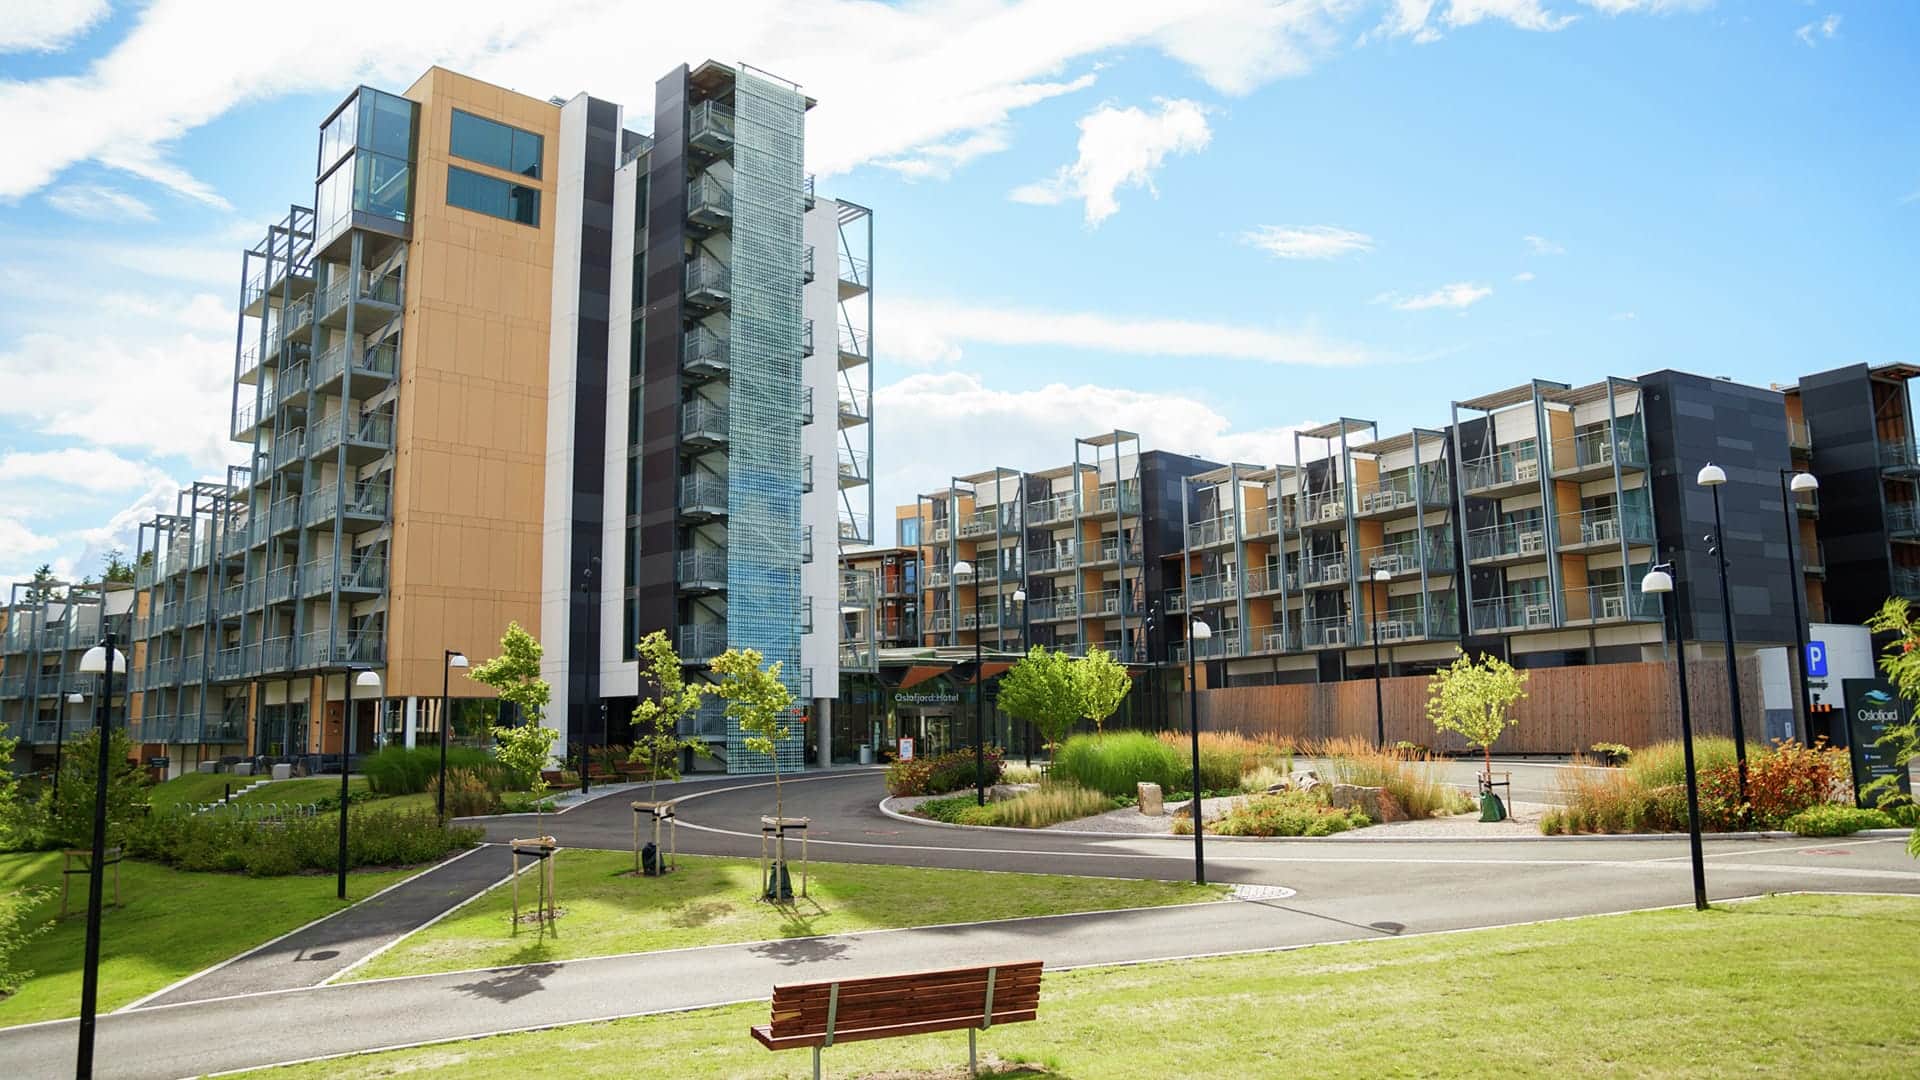
The hotel village consists of 16 hotel buildings with a total of 1600 hotel rooms.
Oslofjord Hotel
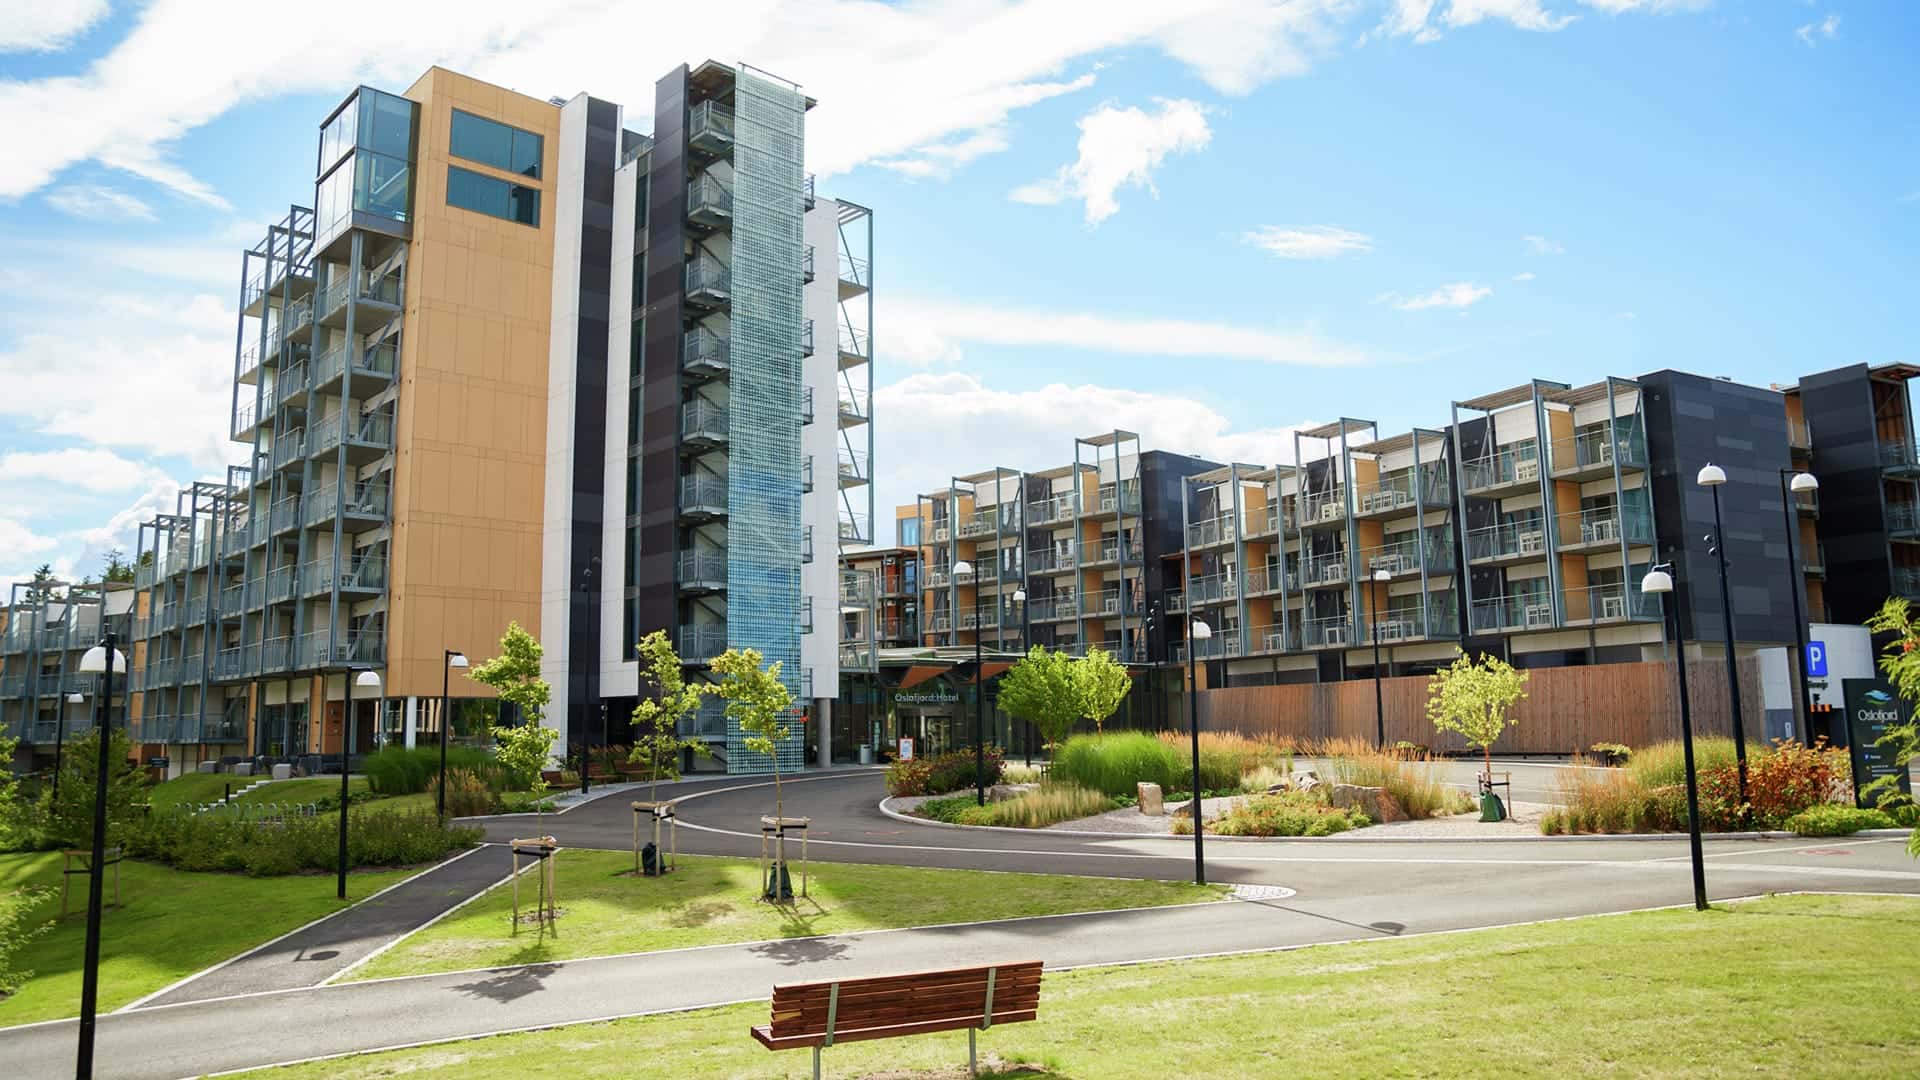
235 rooms, private restaurant, lobby bar and sky bar.
Conference Center South and North
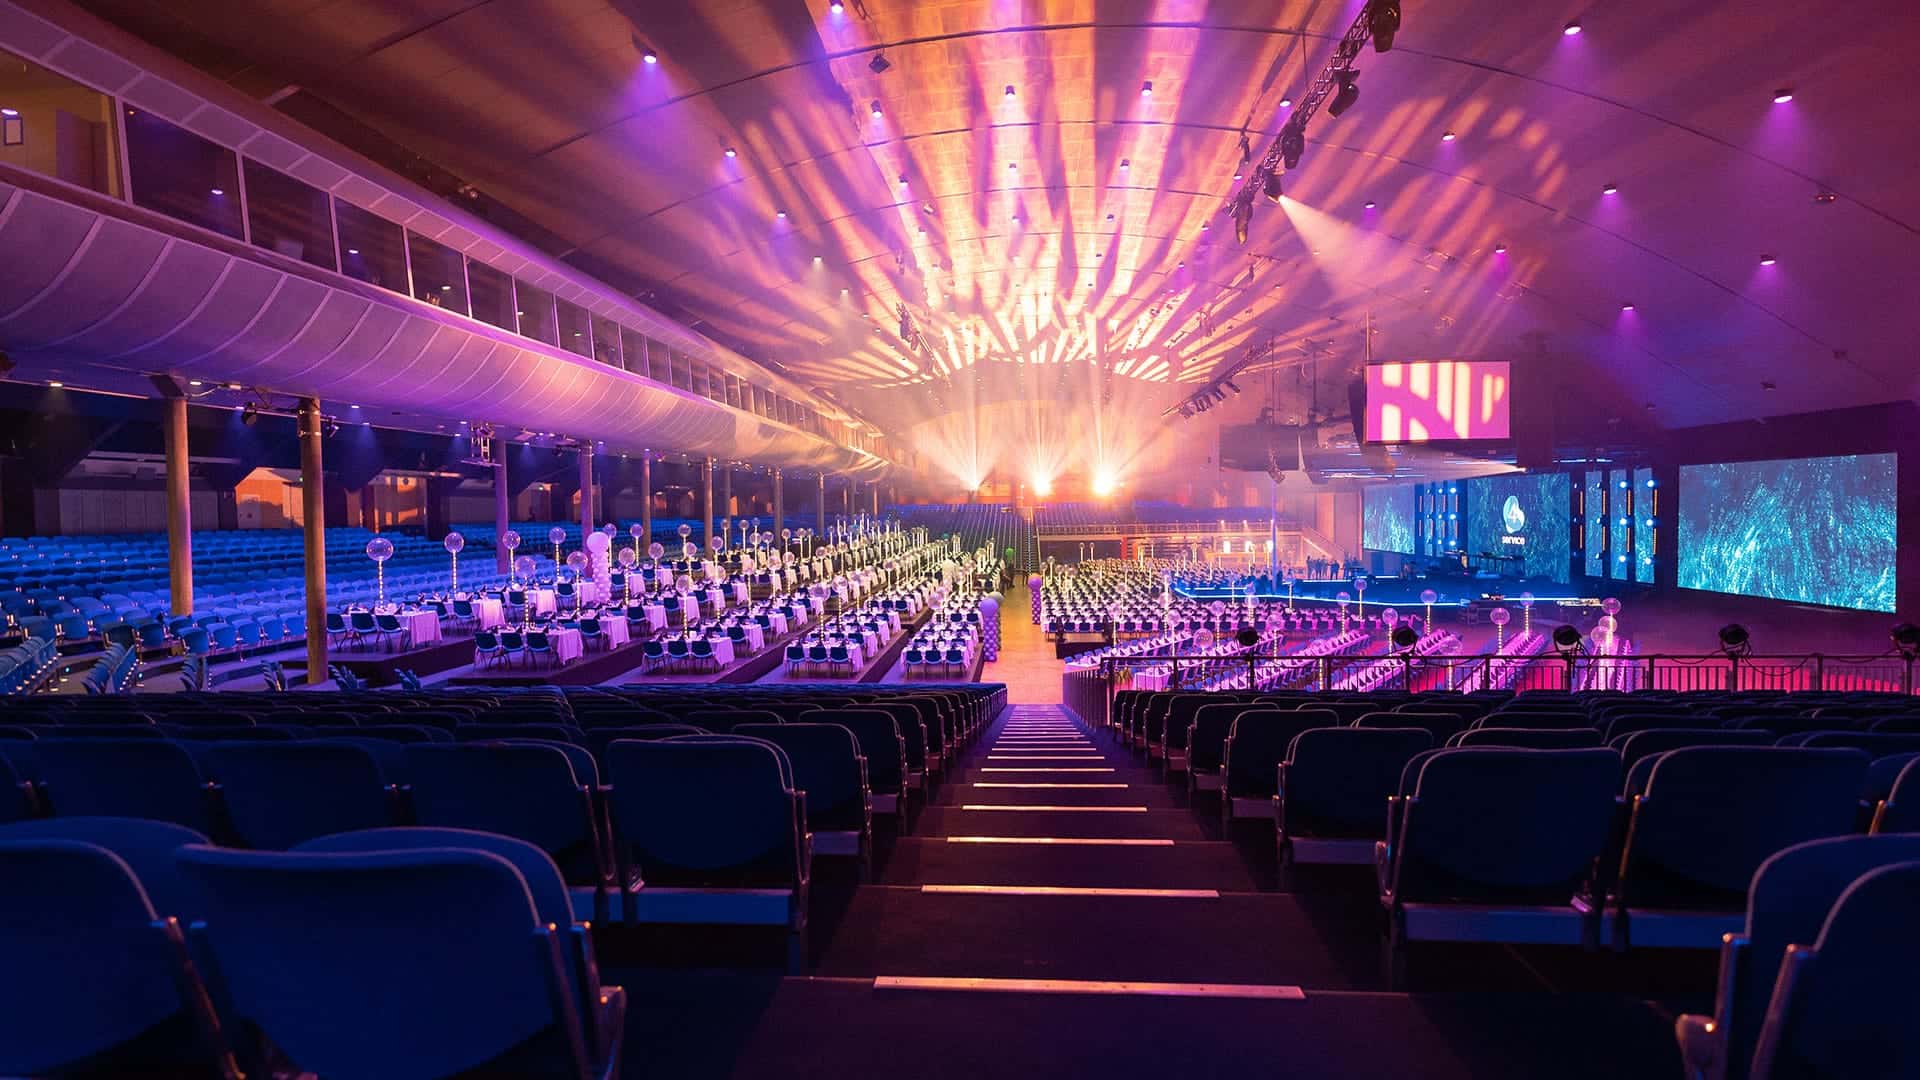
Plenary hall with up to 6800 seats and 11 large meeting rooms.
Parking Facility
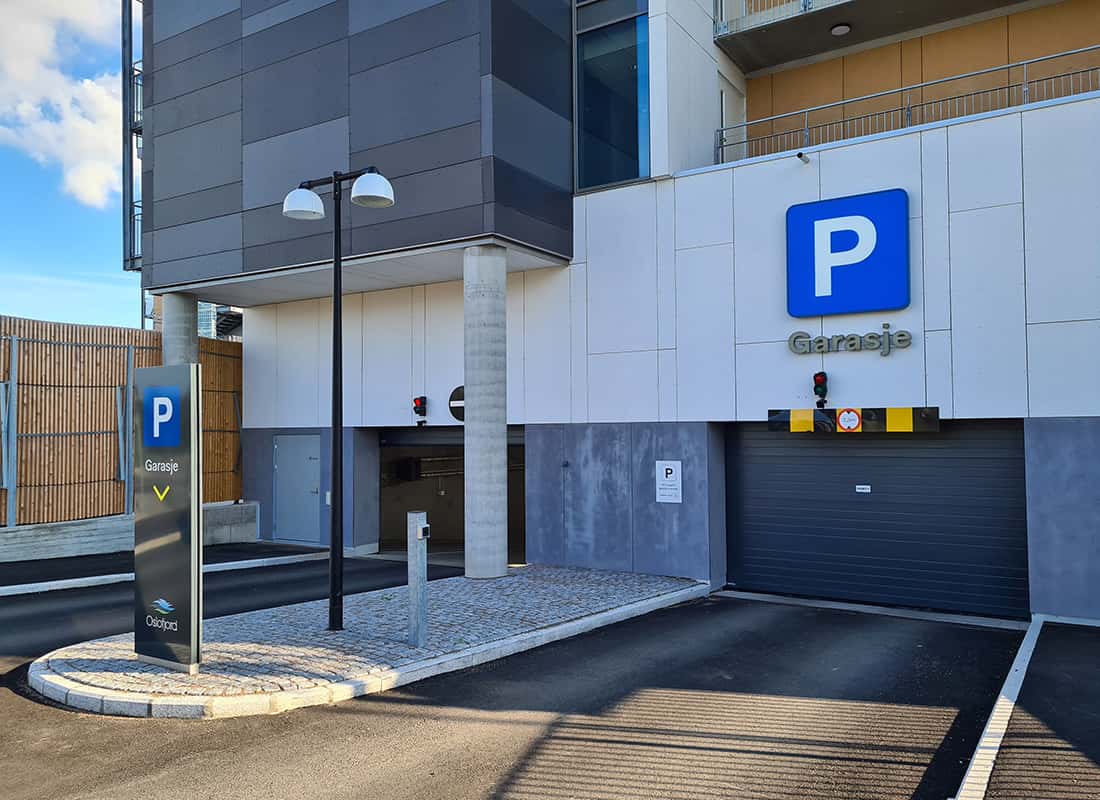
1500 parking spaces, including 110 with charging.
Oslofjord Arena
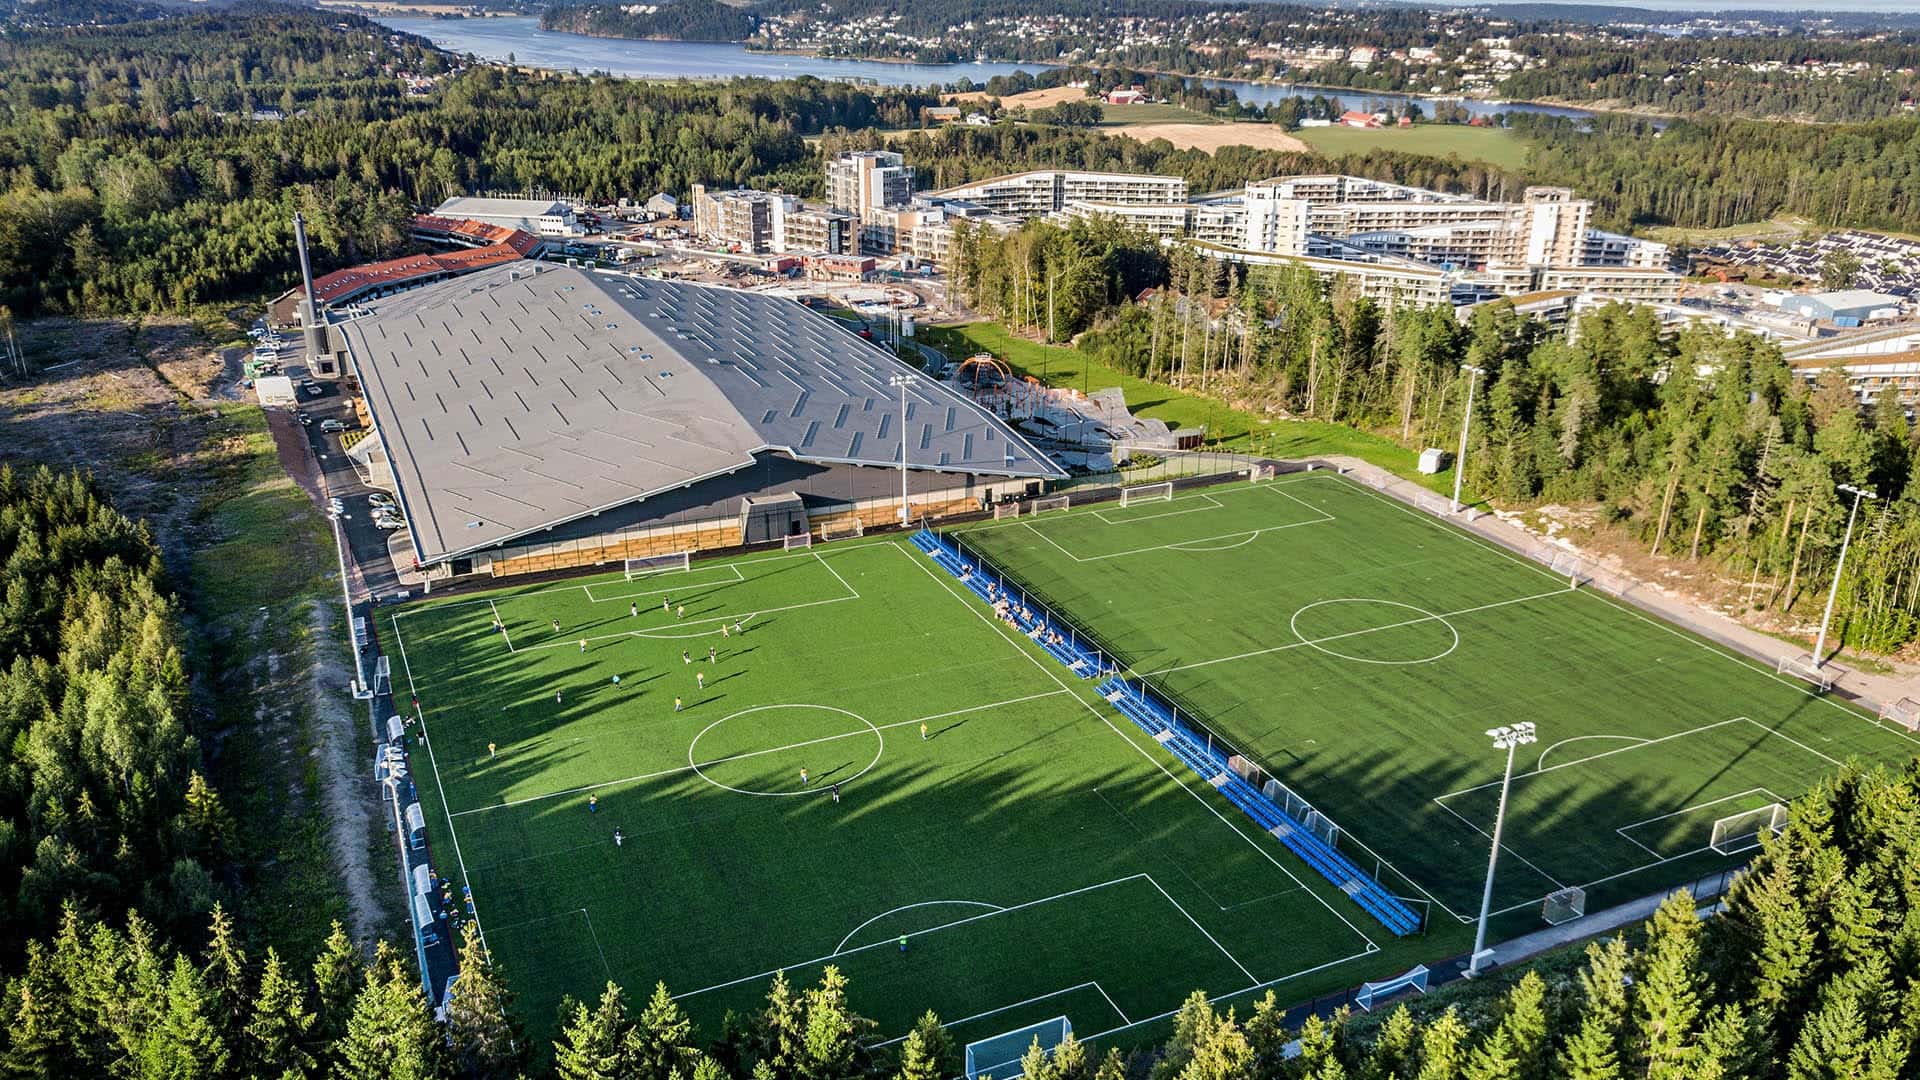
Multi-purpose hall of 15 000 m² for sports, competitions and banquets.

Sound, Lighting & Visuals
With some of Norway’s best venues for sound, lighting and visuals, everything is in place to create memorable experiences for all guests.
This is Oslofjord
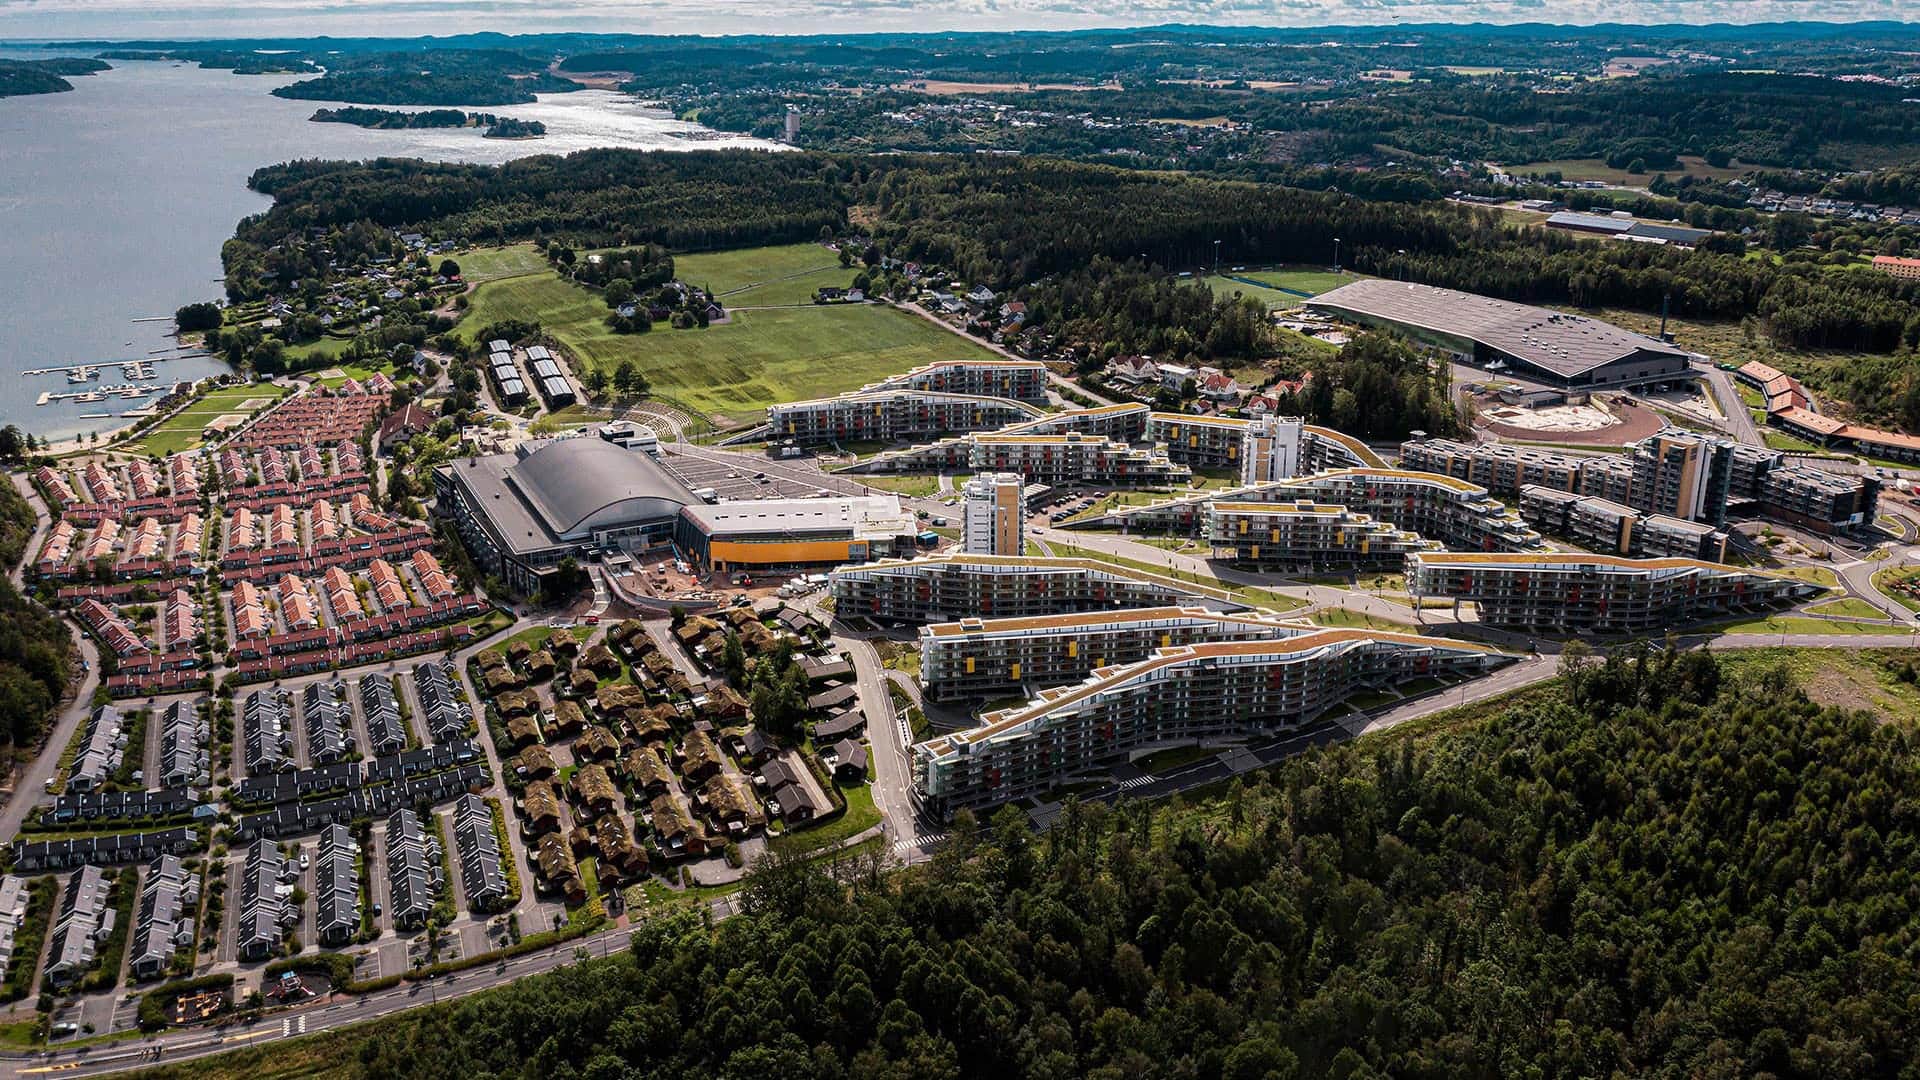
Oslofjord is a conference and event facility by the fjord in Vestfold, developed for national and international conferences, congresses, sporting events and large meetings. The facility is designed to accommodate various types of events and formats, from smaller gatherings to large events with several thousand participants. With venues, accommodation and meeting spaces gathered in one location, combined with open surroundings and proximity to the fjord, all conditions are in place for efficient and seamless events. The combination of capacity, flexibility and location makes Oslofjord a meeting place with few parallels in the Nordic region.
“Many people gathered x time x happiness² = the Oslofjord effect!”

Camilla Hållbro
CEO
Oslofjord Convention Center AS

Helge Nilsen
CEO
Oslofjord Hotel AS

Kjell Sandersen
CEO
Oslofjord Property AS

Jochim Øygarden
CEO
Oslofjord Catering AS
Organization

.png&w=1920&q=75)
Key figures for Oslofjord Holding AS
The Group reported revenue of 130.8 NOK million in the first quarter of 2026, compared with 134.1 NOK million the year before. EBITDA was 38.5 NOK million, while profit before tax was -2.9 NOK million. The development must be viewed in light of the business being seasonally skewed, and the first quarter traditionally having lower volumes than the peak seasons later in the year.
The balance sheet continues to be characterized by significant property values, with property, plant and equipment of 4,078.9 NOK million. Equity was 366.9 NOK million, while long-term financial debt was reduced to 4,302.7 NOK million.
Group key figures :: Result
| NOK thousands | Q1 2026 | Q1 2025 | Change vs 2025 | Cumulative Q1 2026 | Cumulative Q1 2025 | Cumulative change vs 2025 |
|---|---|---|---|---|---|---|
| Revenue | 130,827 | 134,123 | -2.5 % | 120,361 | 123,657 | -2.7 % |
| Cost of goods and direct wages | 41,355 | 37,276 | 10.9 % | 32,544 | 28,465 | 14.3 % |
| Gross profit | 89,472 | 96,848 | -7.6 % | 87,817 | 95,192 | -7.7 % |
| Fixed payroll costs | 29,996 | 27,661 | 8.4 % | 30,141 | 27,806 | 8.4 % |
| Other operating expenses | 20,968 | 25,848 | -18.9 % | 19,168 | 24,047 | -20.3 % |
| Total operating expenses | 92,319 | 90,784 | 1.7 % | 81,852 | 80,318 | 1.9 % |
| EBITDA | 38,508 | 43,339 | -11.1 % | 38,508 | 43,339 | -11.1 % |
| Depreciation and amortization | 30,099 | 28,685 | 4.9 % | 30,099 | 28,685 | 4.9 % |
| EBIT | 8,409 | 14,654 | -42.6 % | 8,409 | 14,654 | -42.6 % |
| Net financial items | -11,334 | -9,707 | -16.8 % | -11,334 | -9,707 | -16.8 % |
| Profit before tax | -2,925 | 4,947 | > -100% | -2,925 | 4,947 | > -100% |
Group key figures :: Balance sheet
| NOK thousands | Q1 2026 | Q1 2025 | Change vs 2025 |
|---|---|---|---|
| ASSETS | |||
| 4,078,898 | 4,140,983 | -1.5 % | |
| 21,736 | 25,969 | -16.3 % | |
| 506,963 | 521,509 | -2.8 % | |
| Non-current assets | 4,607,598 | 4,688,461 | -1.7 % |
| 168,919 | 170,374 | -0.9 % | |
| Total assets | 4,776,517 | 4,858,835 | -1.7 % |
| 366,918 | 345,383 | 6.2 % | |
| 4,302,713 | 4,442,054 | -3.1 % | |
| 106,886 | 71,398 | 49.7 % | |
| Liabilities | 4,409,599 | 4,513,453 | -2.3 % |
| Equity and liabilities | 4,776,517 | 4,858,835 | -1.7 % |
Financial key results
Three central result margins measured against revenue.
Gross profit
87.8 MNOK
How it is calculated
Revenue minus cost of goods and direct payroll: 87.8 MNOK.
Calculation: 87.8 / 120.4 = 73.0 %.
EBITDA
38.5 MNOK
How it is calculated
Result before depreciation and net financial items: 38.5 MNOK.
Calculation: 38.5 / 120.4 = 32.0 %.
Profit before tax
-2.9 MNOK
How it is calculated
EBIT plus net financial items: -2.9 MNOK.
Calculation: -2.9 / 120.4 = -2.4 %.
Bond covenants
How it is calculated
Formula: Net interest-bearing debt / value.
Debt: 1385.5 MNOK - cash 82.3 MNOK = 1303.3 MNOK.
Value: property 4078.9 MNOK + lease 427.5 MNOK = 4506.4 MNOK.
Calculation: 1303.3 / 4506.4 = 28.9 %.
How it is calculated
Formula: EBITDA / net financial items.
EBITDA: 38.5 MNOK.
Net financial items: 11.3 MNOK.
Calculation: 38.5 / 11.3 = 3.4 x.
How it is calculated
Formula: Bank deposits and cash equivalents.
Bank deposits: 82.3 MNOK.
Calculation: 82.3 MNOK.
Business areas
Interim report for each business area in the group
.jpg&w=1920&q=65)
Oslofjord Convention Center AS
Oslofjord Convention Center AS reported revenue of 3.7 NOK million in Q1 2026, compared with 11.4 NOK million in the same period the previous year. EBITDA was -8.2 NOK million, compared with -4.7 NOK million in Q1 2025. The development must be viewed in light of lower activity levels in the quarter, as well as increased fixed costs.
Activity in the business is seasonally skewed, and the first quarter has traditionally had lower volumes than the peak seasons later in the year. At the same time, sales activity has been high throughout the quarter, and booking status for upcoming periods is being closely monitored with a focus on increased capacity utilization and more large-scale events.
Management continues to prioritize efforts to strengthen event volume and increase activity during periods of available capacity throughout the year.
The company continues to experience solid market interest in larger events and meetings in the years ahead.
Oslofjord Convention Center AS :: Income statement
| NOK thousands | Q1 2026 | Q1 2025 | Change vs 2025 | Cumulative Q1 2026 | Cumulative Q1 2025 | Cumulative change vs 2025 |
|---|---|---|---|---|---|---|
| Revenue | 3,657 | 11,397 | -67.9 % | 3,657 | 11,397 | -67.9 % |
| Cost of goods and direct wages | 2,536 | 7,846 | -67.7 % | 2,536 | 7,846 | -67.7 % |
| Gross profit | 1,122 | 3,552 | -68.4 % | 1,122 | 3,552 | -68.4 % |
| Fixed payroll costs | 6,434 | 5,920 | 8.7 % | 6,434 | 5,920 | 8.7 % |
| Other operating expenses | 2,917 | 2,320 | 25.8 % | 2,917 | 2,320 | 25.8 % |
| Total operating expenses | 11,887 | 16,085 | -26.1 % | 11,887 | 16,085 | -26.1 % |
| EBITDA | -8,230 | -4,688 | -75.5 % | -8,230 | -4,688 | -75.5 % |
| Depreciation and amortization | 195 | 88 | >100% | 195 | 88 | >100% |
| EBIT | -8,425 | -4,776 | -76.4 % | -8,425 | -4,776 | -76.4 % |
| Net financial items | 100 | 274 | -63.4 % | 100 | 274 | -63.4 % |
| Profit before tax | -8,325 | -4,503 | -84.9 % | -8,325 | -4,503 | -84.9 % |
Balance sheet :: Oslofjord Convention Center AS
| NOK thousands | Q1 2026 | Q1 2025 | Change vs 2025 |
|---|---|---|---|
| ASSETS | |||
| 2,036 | 2,046 | -0.5 % | |
| 7,977 | 4,642 | 71.8 % | |
| - | 13,290 | -100.0 % | |
| Non-current assets | 10,013 | 19,978 | -49.9 % |
| 31,801 | 11,608 | >100% | |
| Total assets | 41,815 | 31,586 | 32.4 % |
| 18,336 | 21,318 | -14.0 % | |
| 23,478 | 10,268 | >100% | |
| Liabilities | 23,478 | 10,268 | >100% |
| Equity and liabilities | 41,815 | 31,586 | 32.4 % |
Oslofjord Hotel AS
Oslofjord Hotel AS reported revenue of 126.8 NOK million in Q1 2026, compared with 122.8 NOK million in the same period last year. EBITDA was 4.4 NOK million, compared with 5.1 NOK million in Q1 2025, while EBIT was 0.6 NOK million compared with 1.4 NOK million the previous year. The development must be viewed in light of increased costs and a changed activity mix during the quarter.
The revenue growth was primarily related to increased activity within operations, management and maintenance (FDV). At the same time, higher operating and payroll costs affected profit margins in the period.
Operations have been stable throughout the quarter, with activity levels in line with the seasonal pattern. The booking outlook for the coming quarters shows stable demand, and work on cost control and capacity utilisation will continue throughout the year.Oslofjord Hotel continues to experience stable demand related to events and activity at the facility.
Oslofjord Hotel AS :: Income statement
| NOK thousands | Q1 2026 | Q1 2025 | Change vs 2025 | Cumulative Q1 2026 | Cumulative Q1 2025 | Cumulative change vs 2025 |
|---|---|---|---|---|---|---|
| Revenue | 126,799 | 122,763 | 3.3 % | 126,799 | 122,763 | 3.3 % |
| Cost of goods and direct wages | 28,365 | 26,254 | 8.0 % | 28,365 | 26,254 | 8.0 % |
| Gross profit | 98,434 | 96,508 | 2.0 % | 98,434 | 96,508 | 2.0 % |
| Fixed payroll costs | 18,080 | 17,288 | 4.6 % | 18,080 | 17,288 | 4.6 % |
| Other operating expenses | 75,945 | 74,107 | 2.5 % | 75,945 | 74,107 | 2.5 % |
| Total operating expenses | 122,390 | 117,649 | 4.0 % | 122,390 | 117,649 | 4.0 % |
| EBITDA | 4,408 | 5,114 | -13.8 % | 4,408 | 5,114 | -13.8 % |
| Depreciation and amortization | 3,847 | 3,748 | 2.6 % | 3,847 | 3,748 | 2.6 % |
| EBIT | 562 | 1,366 | -58.9 % | 562 | 1,366 | -58.9 % |
| Net financial items | 248 | -186 | >100% | 248 | -186 | >100% |
| Profit before tax | 810 | 1,180 | -31.4 % | 810 | 1,180 | -31.4 % |
Balance sheet :: Oslofjord Hotel AS
| NOK thousands | Q1 2026 | Q1 2025 | Change vs 2025 |
|---|---|---|---|
| ASSETS | |||
| 70,259 | 68,273 | 2.9 % | |
| 1,635 | 4,868 | -66.4 % | |
| 2,927,420 | 3,013,869 | -2.9 % | |
| Non-current assets | 2,999,314 | 3,087,009 | -2.8 % |
| 53,846 | 78,614 | -31.5 % | |
| Total assets | 3,053,160 | 3,165,623 | -3.6 % |
| 93,877 | 82,485 | 13.8 % | |
| 2,917,163 | 3,022,725 | -3.5 % | |
| 42,120 | 60,413 | -30.3 % | |
| Liabilities | 2,959,283 | 3,083,138 | -4.0 % |
| Equity and liabilities | 3,053,160 | 3,165,623 | -3.6 % |

Oslofjord Catering AS
Oslofjord Catering AS reported revenue of 9.2 NOK million in Q1 2026, compared with 9.8 NOK million in the same period in 2025. EBITDA was -4.5 NOK million, compared with -2.6 NOK million in Q1 the previous year. The development must be viewed in light of somewhat lower activity levels and increased costs during the period.
The quarter was characterized by lower serving volumes than in the same period the previous year, while the cost level has been higher.
The company is actively working with cost control and ongoing measures to strengthen efficiency and capacity utilization in operations.
Activity levels are expected to increase throughout the year in line with event activity at Oslofjord.
The company will continue to prioritize efforts related to efficient operations and cost control in the coming periods.
Oslofjord Catering AS :: Income statement
| NOK thousands | Q1 2026 | Q1 2025 | Change vs 2025 | Cumulative Q1 2026 | Cumulative Q1 2025 | Cumulative change vs 2025 |
|---|---|---|---|---|---|---|
| Revenue | 9,150 | 9,758 | -6.2 % | 9,150 | 9,758 | -6.2 % |
| Cost of goods and direct wages | 8,372 | 7,104 | 17.9 % | 8,372 | 7,104 | 17.9 % |
| Gross profit | 779 | 2,654 | -70.7 % | 779 | 2,654 | -70.7 % |
| Fixed payroll costs | 3,915 | 3,788 | 3.4 % | 3,915 | 3,788 | 3.4 % |
| Other operating expenses | 1,379 | 1,461 | -5.6 % | 1,379 | 1,461 | -5.6 % |
| Total operating expenses | 13,666 | 12,352 | 10.6 % | 13,666 | 12,352 | 10.6 % |
| EBITDA | -4,515 | -2,594 | -74.1 % | -4,515 | -2,594 | -74.1 % |
| Depreciation and amortization | 35 | 37 | -6.4 % | 35 | 37 | -6.4 % |
| EBIT | -4,550 | -2,632 | -72.9 % | -4,550 | -2,632 | -72.9 % |
| Net financial items | -61 | -109 | 44.2 % | -61 | -109 | 44.2 % |
| Profit before tax | -4,611 | -2,741 | -68.2 % | -4,611 | -2,741 | -68.2 % |
Balance sheet :: Oslofjord Catering AS
| NOK thousands | Q1 2026 | Q1 2025 | Change vs 2025 |
|---|---|---|---|
| ASSETS | |||
| 405 | 316 | 28.4 % | |
| 1,265 | 786 | 61.0 % | |
| Non-current assets | 1,671 | 1,101 | 51.7 % |
| 43,568 | 33,767 | 29.0 % | |
| Total assets | 45,239 | 34,868 | 29.7 % |
| 5,390 | 7,171 | -24.8 % | |
| 11,140 | 10,466 | 6.4 % | |
| 28,709 | 17,231 | 66.6 % | |
| Liabilities | 39,849 | 27,697 | 43.9 % |
| Equity and liabilities | 45,239 | 34,868 | 29.7 % |
Oslofjord Property AS
Oslofjord Property AS reported operating revenues of 63.9 NOK million in Q1 2026, compared with 62.6 NOK million in the same period the previous year. The development reflects ordinary growth in rental income.
EBITDA was 49.7 NOK million, compared with 48.6 NOK million in Q1 2025, while EBIT was 24.2 NOK million compared with 23.8 NOK million the previous year. Profit before tax was 13.7 NOK million, compared with 12.1 NOK million in the same period in 2025.
Depreciation increased to 25.5 NOK million as a result of completed investments and ongoing upgrades in the property portfolio.
At the end of the quarter, the company had total assets of 4 054 NOK million and equity of 388.3 NOK million. Going forward, follow-up of operations, maintenance and cost control will be key priorities in the business.
At the same time, the property portfolio provides the Group with a solid foundation for further development of activity and operations in Oslofjord.
Oslofjord Property AS :: Income statement
| NOK thousands | Q1 2026 | Q1 2025 | Change vs 2025 | Cumulative Q1 2026 | Cumulative Q1 2025 | Cumulative change vs 2025 |
|---|---|---|---|---|---|---|
| Revenue | 63,879 | 62,615 | 2.0 % | 63,879 | 62,615 | 2.0 % |
| Cost of goods and direct wages | 6,235 | - | >100% | 6,235 | - | >100% |
| Gross profit | 57,644 | 62,615 | -7.9 % | 57,644 | 62,615 | -7.9 % |
| Fixed payroll costs | 1,165 | 801 | 45.5 % | 1,165 | 801 | 45.5 % |
| Other operating expenses | 6,805 | 13,239 | -48.6 % | 6,805 | 13,239 | -48.6 % |
| Total operating expenses | 14,205 | 14,039 | 1.2 % | 14,205 | 14,039 | 1.2 % |
| EBITDA | 49,674 | 48,575 | 2.3 % | 49,674 | 48,575 | 2.3 % |
| Depreciation and amortization | 25,473 | 24,802 | 2.7 % | 25,473 | 24,802 | 2.7 % |
| EBIT | 24,201 | 23,773 | 1.8 % | 24,201 | 23,773 | 1.8 % |
| Net financial items | -10,536 | -11,688 | 9.9 % | -10,536 | -11,688 | 9.9 % |
| Profit before tax | 13,665 | 12,085 | 13.1 % | 13,665 | 12,085 | 13.1 % |
Balance sheet :: Oslofjord Property AS
| NOK thousands | Q1 2026 | Q1 2025 | Change vs 2025 |
|---|---|---|---|
| ASSETS | |||
| 4,006,198 | 4,070,348 | -1.6 % | |
| - | 7,958 | -100.0 % | |
| 5,030 | 8,109 | -38.0 % | |
| Non-current assets | 4,011,228 | 4,086,415 | -1.8 % |
| 42,523 | 41,610 | 2.2 % | |
| Total assets | 4,053,751 | 4,128,025 | -1.8 % |
| 388,256 | 350,487 | 10.8 % | |
| 3,642,547 | 3,757,691 | -3.1 % | |
| 22,949 | 19,846 | 15.6 % | |
| Liabilities | 3,665,495 | 3,777,537 | -3.0 % |
| Equity and liabilities | 4,053,751 | 4,128,025 | -1.8 % |

Oslofjord Property Prosjekt AS
Income statement
| NOK thousands | Q1 2026 | Q1 2025 | Change vs 2025 | Cumulative Q1 2026 | Cumulative Q1 2025 | Cumulative change vs 2025 |
|---|---|---|---|---|---|---|
| Revenue | - | - | - | - | - | - |
| Cost of goods and direct wages | - | - | - | - | - | - |
| Gross profit | - | - | - | - | - | - |
| Fixed payroll costs | - | 1 | -100.0 % | - | 1 | -100.0 % |
| Other operating expenses | 28 | 34 | -17.3 % | 28 | 34 | -17.3 % |
| Total operating expenses | 28 | 35 | -18.7 % | 28 | 35 | -18.7 % |
| EBITDA | -28 | -35 | 18.7 % | -28 | -35 | 18.7 % |
| Depreciation and amortization | - | - | - | - | - | - |
| EBIT | -28 | -35 | 18.7 % | -28 | -35 | 18.7 % |
| Net financial items | 61 | 26 | >100% | 61 | 26 | >100% |
| Profit before tax | 33 | -9 | >100% | 33 | -9 | >100% |
Balance sheet
| NOK thousands | Q1 2026 | Q1 2025 | Change vs 2025 |
|---|---|---|---|
| ASSETS | |||
| - | 2 | -100.0 % | |
| 4,091 | 4,713 | -13.2 % | |
| Non-current assets | 4,091 | 4,715 | -13.2 % |
| 302 | 2,642 | -88.6 % | |
| Total assets | 4,393 | 7,357 | -40.3 % |
| 4,394 | 4,245 | 3.5 % | |
| - | 3,079 | -100.0 % | |
| -1 | 33 | > -100% | |
| Liabilities | -1 | 3,111 | > -100% |
| Equity and liabilities | 4,393 | 7,357 | -40.3 % |
Oslofjord Rental AS
Income statement
| NOK thousands | Q1 2026 | Q1 2025 | Change vs 2025 | Cumulative Q1 2026 | Cumulative Q1 2025 | Cumulative change vs 2025 |
|---|---|---|---|---|---|---|
| Revenue | - | - | - | - | - | - |
| Cost of goods and direct wages | - | - | - | - | - | - |
| Gross profit | - | - | - | - | - | - |
| Fixed payroll costs | - | - | - | - | - | - |
| Other operating expenses | 8 | -18 | >100% | 8 | -18 | >100% |
| Total operating expenses | 8 | -18 | >100% | 8 | -18 | >100% |
| EBITDA | -8 | 18 | > -100% | -8 | 18 | > -100% |
| Depreciation and amortization | - | - | - | - | - | - |
| EBIT | -8 | 18 | > -100% | -8 | 18 | > -100% |
| Net financial items | -1 | - | > -100% | -1 | - | > -100% |
| Profit before tax | -10 | 18 | > -100% | -10 | 18 | > -100% |
Balance sheet
| NOK thousands | Q1 2026 | Q1 2025 | Change vs 2025 |
|---|---|---|---|
| ASSETS | |||
| 2 | - | >100% | |
| Non-current assets | 2 | - | >100% |
| 105 | 74 | 41.4 % | |
| Total assets | 107 | 74 | 44.3 % |
| 23 | 3 | >100% | |
| 82 | 76 | 8.2 % | |
| 2 | -4 | >100% | |
| Liabilities | 84 | 71 | 17.8 % |
| Equity and liabilities | 107 | 74 | 44.3 % |
Profit before tax in Oslofjord Holding AS was -4.5 NOK million in Q1 2026, compared with -1.1 NOK million in the same period the previous year. The development primarily reflects higher interest expenses related to the Group’s financing.
Net financial items amounted to -1.7 NOK million in the quarter, compared with 2.0 NOK million in Q1 2025. At the same time, operating profit improved compared with the same period last year as a result of lower operating expenses.
Activity in Oslofjord Holding AS has otherwise been stable and in line with the company’s role as the Group’s administrative entity. The work on monitoring the Group’s financing structure and cost control will continue throughout the year.
Oslofjord Holding AS will continue to play a central role in the Group’s further development and long-term priorities.
Oslofjord Holding :: Income statement
| NOK thousands | Q1 2026 | Q1 2025 | Change vs 2025 | Cumulative Q1 2026 | Cumulative Q1 2025 | Cumulative change vs 2025 |
|---|---|---|---|---|---|---|
| Revenue | 10 | 259 | -96.3 % | 10 | 259 | -96.3 % |
| Cost of goods and direct wages | - | 225 | -100.0 % | - | 225 | -100.0 % |
| Gross profit | 10 | 34 | -71.9 % | 10 | 34 | -71.9 % |
| Fixed payroll costs | 1,083 | 545 | 98.5 % | 1,083 | 545 | 98.5 % |
| Other operating expenses | 1,719 | 2,539 | -32.3 % | 1,719 | 2,539 | -32.3 % |
| Total operating expenses | 2,801 | 3,309 | -15.4 % | 2,801 | 3,309 | -15.4 % |
| EBITDA | -2,792 | -3,050 | 8.5 % | -2,792 | -3,050 | 8.5 % |
| Depreciation and amortization | 549 | 9 | >100% | 549 | 9 | >100% |
| EBIT | -3,341 | -3,059 | -9.2 % | -3,341 | -3,059 | -9.2 % |
| Net financial items | -1,145 | 1,976 | > -100% | -1,145 | 1,976 | > -100% |
| Profit before tax | -4,486 | -1,084 | > -100% | -4,486 | -1,084 | > -100% |
Balance sheet :: Oslofjord Holding
| NOK thousands | Q1 2026 | Q1 2025 | Change vs 2025 |
|---|---|---|---|
| ASSETS | |||
| 9,085 | 5,351 | 69.8 % | |
| 1,779,884 | 1,811,912 | -1.8 % | |
| Non-current assets | 1,788,968 | 1,817,263 | -1.6 % |
| 17,621 | 38,640 | -54.4 % | |
| Total assets | 1,806,589 | 1,855,903 | -2.7 % |
| 396,215 | 409,523 | -3.2 % | |
| 1,399,898 | 1,446,188 | -3.2 % | |
| 10,476 | 192 | >100% | |
| Liabilities | 1,410,374 | 1,446,380 | -2.5 % |
| Equity and liabilities | 1,806,589 | 1,855,903 | -2.7 % |